LinkedIn Engagement Rate Calculator
We have provided a useful LinkedIn Engagement Rate Calculator below. Use it to
work out the Engagement Rate for your updates, or your LinkedIn page.
You can also work out the total impressions and engagements you would need in order to hit a specific
Engagement Rate on any update. Feel free to experiment with different scenarios in order to help you
better understand this metric.
LinkedIn Engagement Rate Calculator
How to Calculate LinkedIn Engagement Rate
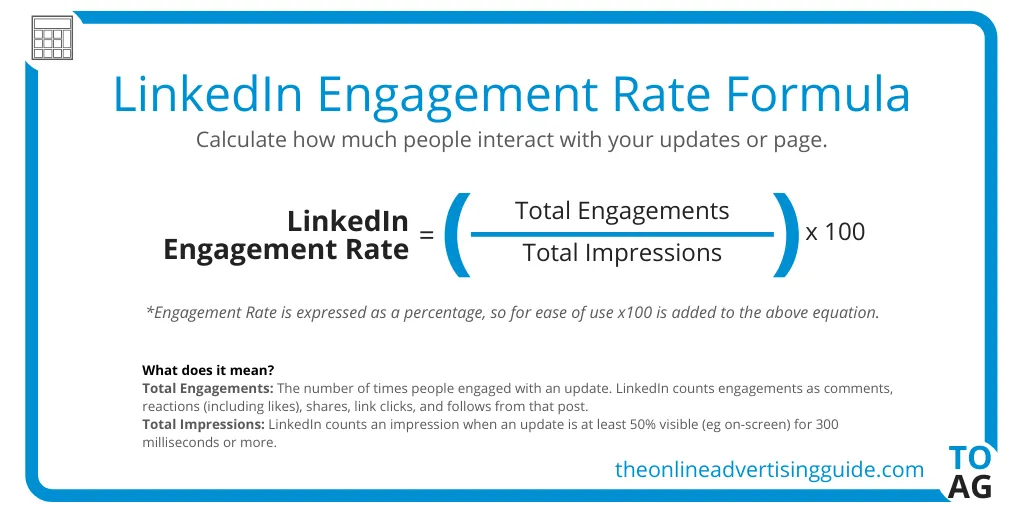
The equation for LinkedIn Engagement is:

What counts as an engagement on LinkedIn?
LinkedIn counts Clicks, Comments, Reactions (which included Likes), and Shares as engagements. LinkedIn also includes Follows as engagements as you are able to follow pages directly from an update by hovering over the person or page that posted the updates name.
What counts as an Impression on LinkedIn?
LinkedIn uses its own form of viewable impression. It only counts impressions when an update is
more than 50% on screen for over 300 milliseconds. The standard use of viewable impressions is
that an ad is over 50% onscreen for 1 continuous second. This is an improvement on how most
social networks counts impressions – which is that they just count posts/ads loading in a feed
whether they are seen or not.
It should also be noted that by using viewable impressions, LinkedIn is reducing the number of
impressions counted. This in turn will increase the engagement to impression ratio, and
therefore the engagement rate.