Year-on-Year change Calculator
Year-on-Year calculations are the most useful and trustworthy way to measure
performance.
By comparing your current performance to the same period last year, you can see whether you are
objectively doing good or bad – all while taking into account seasonal variations.
Below we have provided a useful online Year-on-Year Calculator to measure the change in your
performance. You can also work out previous performance if you know the Year-on-Year change and this
years results.
Feel free to experiment with different scenarios using our Year-on-Year Calculator in order to help you
better understand this metric.
Year-on-Year Change Calculator
Year-on-Year Definition
Year-on-Year (or YoY) calculations mean comparing one period to the same
period in the year before. You don’t have to cover a whole year, or use data from this year –
however, in both cases you can.
For example, you could look at a:
- annual sale – as in Black Friday weekend this year versus Black Friday weekend last year
- specific day – as in the first Monday of March versus the first Monday of March last year
- specific dates (or a date range) – as in the 5-25th of August this year versus the 5th-25th of August last year
- metric – as in how many newsletter sign ups you got this year versus how many you got last year
- product – as in how much paper you sold this year versus last year
- page – as in how the exit rate of a page compares this year to last year
Or any combination of the above. The key point is that you are comparing a time frame from this year to the equivalent time from last year.
Note: Leap Years can cause small problems for Year-on-Year comparisons, especially if you are programmatically looking back 365 days. Always double check your reporting after February 29th in a leap year!
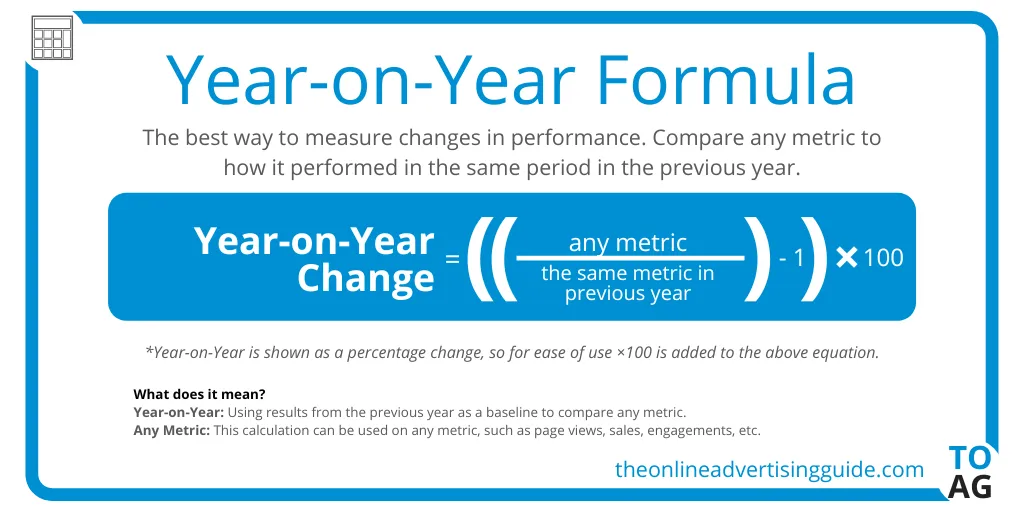
How to Calculate Year-on-Year Change
The equation for change is:

Alternate Equation
The Year-on-Year calculation we have provided is the most convenient to
use, especially on a calculator. However, there are other ways to calculate Year-on-Year changes.
They all come out with the same answer, but you input them in different ways.
The most commonly used Year-on-Year calculation is:
((This Year – Previous Year) ÷ Previous Year) x100
I personally don’t like this equation so much as if you are using a calculator then you have to
input the second number twice.
If you want to work out a Year-on-Year change in Excel, then the equation is even simpler:
 (Any Metric ÷ Same Metric from the previous year)
-100%
This only works because Excel will turn this calculation into a percentage automatically. If you did
this same calculation in a calculator you would get 0.
When should I use Year-on-Year calculations?
Year-on-Year calculations are the most useful of all comparisons. This is
because they take seasonal changes out of the equation. While you can be fairly sure that Monday
this week and Monday last week will perform about the same, this can’t be said for a random week in
July compared to a random week in November.
People react differently to different things in different seasons. For example, before Christmas
people go on spending sprees but after Christmas people have less cash to spend. Or people spend
less time on the internet when it’s sunny so websites don’t earn as much ad revenue in Summer.
So to ensure that you are comparing like-for-like, you should use Year-on-Year comparisons whenever
possible.
Note: Any time you click “Compare to: previous year” in a platform (such as
Google Analytics), you will be comparing to the same dates in the previous year. If you experience
significantly different performance on weekends to weekdays, this can cause problems.
I recommend always adjusting so the first date in the comparison period is the same day of the week
as the period being compared.

When shouldn’t I use Year-on-Year calculations?
If you had a particularly good year, it can be a bit depressing to use
Year-on-Year comparisons the next year as you’ll always be struggling.
Similarly, you may be painting a false picture of success if you had a bad year, and then compare
yourself to it for the whole of next year.
When either of these things occur, I would recommend using a 3 Year Average
instead. This will help even out the ‘outlier’ year.
3 Year average example
If you were looking at page views in August, you would:
- Take the page views from the previous three years in August
- Add them all up
- Divide them by 3
- Use that figure in the above calculator
Who are Year-on-Year comparisons useful for?
Year-on-Year comparisons are useful for almost everybody. This is because:
- It’s easy to understand the comparison (“we did better/worse than last year”)
- It takes into account seasonable variations (“the same was true last year”)
- It’s a consistent measure (“we stayed x% above last year come rain or shine”)
With weekly or monthly reporting you are getting the results of short term changes. With Year-on-Year reporting, you are seeing much more clearly whether results have improved or not.